|
|
||
|---|---|---|
| .. | ||
| examples | ||
| screenshots | ||
| tracing | ||
| utils | ||
| .env.example | ||
| README.md | ||
| requirements.txt | ||
| setup.py | ||
| test_tracing.py | ||
README.md
PocketFlow Tracing with Langfuse
This cookbook provides comprehensive observability for PocketFlow workflows using Langfuse as the tracing backend. With minimal code changes (just adding a decorator), you can automatically trace all node executions, inputs, outputs, and errors in your PocketFlow workflows.
🎯 Features
- Automatic Tracing: Trace entire flows with a single decorator
- Node-Level Observability: Automatically trace
prep,exec, andpostphases of each node - Input/Output Tracking: Capture all data flowing through your workflow
- Error Tracking: Automatically capture and trace exceptions
- Async Support: Full support for AsyncFlow and AsyncNode
- Minimal Code Changes: Just add
@trace_flow()to your flow classes - Langfuse Integration: Leverage Langfuse's powerful observability platform
🚀 Quick Start
1. Install Dependencies
pip install -r requirements.txt
2. Environment Setup
Copy the example environment file and configure your Langfuse credentials:
cp .env.example .env
Then edit the .env file with your actual Langfuse configuration:
LANGFUSE_SECRET_KEY=your-langfuse-secret-key
LANGFUSE_PUBLIC_KEY=your-langfuse-public-key
LANGFUSE_HOST=your-langfuse-host-url
POCKETFLOW_TRACING_DEBUG=true
Note: Replace the placeholder values with your actual Langfuse credentials and host URL.
3. Basic Usage
from pocketflow import Node, Flow
from tracing import trace_flow

class MyNode(Node):
    def prep(self, shared):
        return shared["input"]

    def exec(self, data):
        return f"Processed: {data}"

    def post(self, shared, prep_res, exec_res):
        shared["output"] = exec_res
        return "default"

@trace_flow()  # 🎉 That's it! Your flow is now traced
class MyFlow(Flow):
    def __init__(self):
        super().__init__(start=MyNode())

# Run your flow - tracing happens automatically
flow = MyFlow()
shared = {"input": "Hello World"}
flow.run(shared)
📊 What Gets Traced
When you apply the @trace_flow() decorator, the system automatically traces:
Flow Level
- Flow Start/End: Overall execution time and status
- Input Data: Initial shared state when flow starts
- Output Data: Final shared state when flow completes
- Errors: Any exceptions that occur during flow execution
Node Level
For each node in your flow, the system traces:
-
prep() Phase:
- Input:
shareddata - Output:
prep_resreturned by prep method - Execution time and any errors
- Input:
-
exec() Phase:
- Input:
prep_resfrom prep phase - Output:
exec_resreturned by exec method - Execution time and any errors
- Retry attempts (if configured)
- Input:
-
post() Phase:
- Input:
shared,prep_res,exec_res - Output: Action string returned
- Execution time and any errors
- Input:
🔧 Configuration Options
Basic Configuration
from tracing import trace_flow, TracingConfig

# Use environment variables (default)
@trace_flow()
class MyFlow(Flow):
    pass

# Custom flow name
@trace_flow(flow_name="CustomFlowName")
class MyFlow(Flow):
    pass

# Custom session and user IDs
@trace_flow(session_id="session-123", user_id="user-456")
class MyFlow(Flow):
    pass
Advanced Configuration
from tracing import TracingConfig

# Create custom configuration
config = TracingConfig(
    langfuse_secret_key="your-secret-key",
    langfuse_public_key="your-public-key",
    langfuse_host="https://your-langfuse-instance.com",
    debug=True,
    trace_inputs=True,
    trace_outputs=True,
    trace_errors=True
)

@trace_flow(config=config)
class MyFlow(Flow):
    pass
📁 Examples
Basic Synchronous Flow
See examples/basic_example.py for a complete example of tracing a simple synchronous flow.
cd examples
python basic_example.py
Asynchronous Flow
See examples/async_example.py for tracing AsyncFlow and AsyncNode.
cd examples
python async_example.py
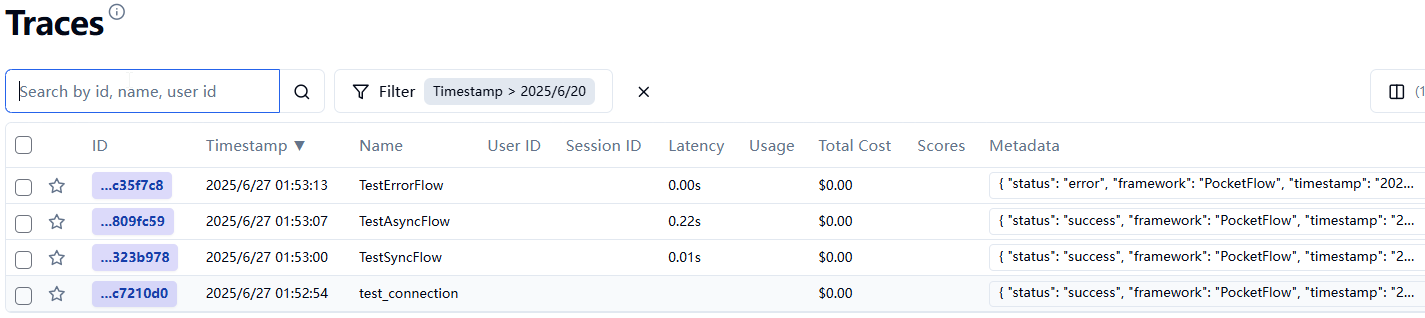
🔍 Viewing Traces
After running your traced flows, visit your Langfuse dashboard to view the traces:
Dashboard URL: Use the URL you configured in LANGFUSE_HOST environment variable
In the dashboard you'll see:
- Traces: One trace per flow execution
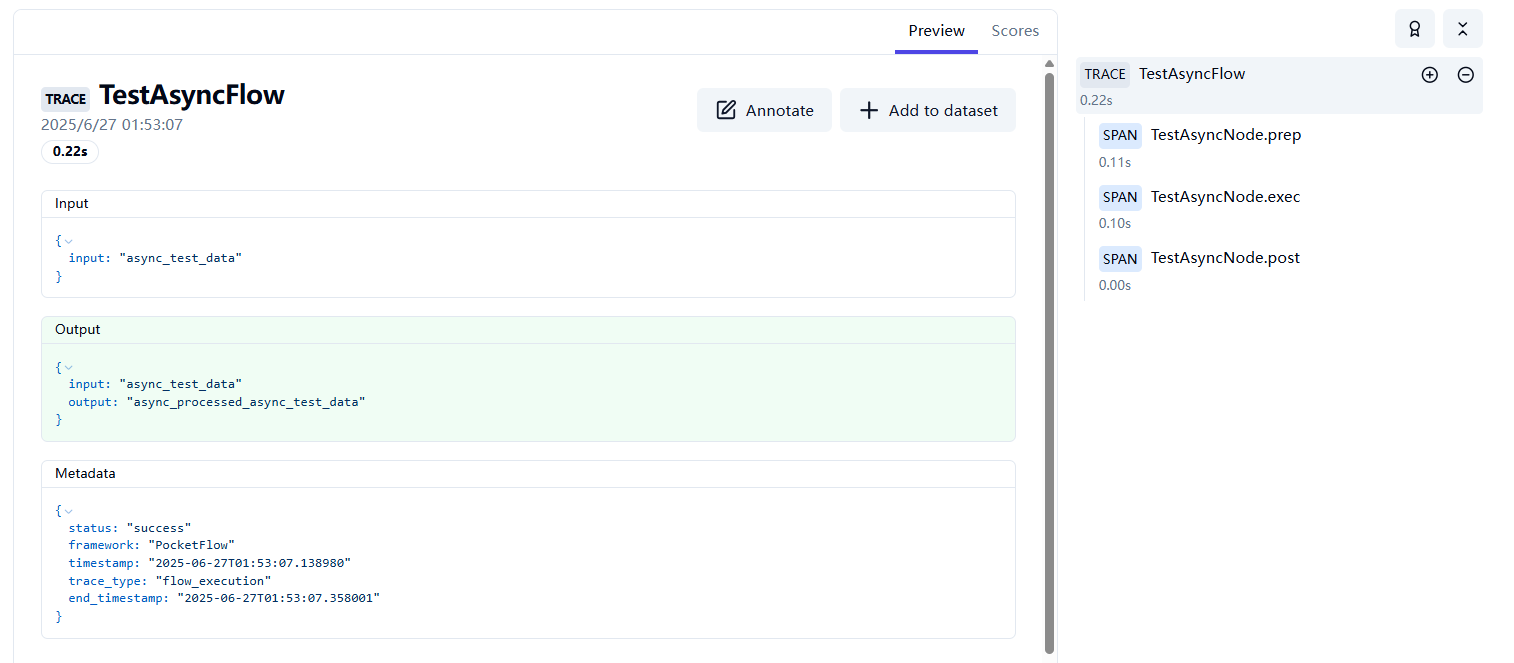
- Spans: Individual node phases (prep, exec, post)
- Input/Output Data: All data flowing through your workflow
- Performance Metrics: Execution times for each phase
- Error Details: Stack traces and error messages
The tracings in examples.
Detailed tracing for a node.
🛠️ Advanced Usage
Custom Tracer Configuration
from tracing import TracingConfig, LangfuseTracer

# Create custom configuration
config = TracingConfig.from_env()
config.debug = True

# Use tracer directly (for advanced use cases)
tracer = LangfuseTracer(config)
Environment Variables
You can customize tracing behavior with these environment variables:
# Required Langfuse configuration
LANGFUSE_SECRET_KEY=your-secret-key
LANGFUSE_PUBLIC_KEY=your-public-key
LANGFUSE_HOST=your-langfuse-host

# Optional tracing configuration
POCKETFLOW_TRACING_DEBUG=true
POCKETFLOW_TRACE_INPUTS=true
POCKETFLOW_TRACE_OUTPUTS=true
POCKETFLOW_TRACE_PREP=true
POCKETFLOW_TRACE_EXEC=true
POCKETFLOW_TRACE_POST=true
POCKETFLOW_TRACE_ERRORS=true

# Optional session/user tracking
POCKETFLOW_SESSION_ID=your-session-id
POCKETFLOW_USER_ID=your-user-id
🐛 Troubleshooting
Common Issues
-
"langfuse package not installed"
pip install langfuse -
"Langfuse client initialization failed"
- Check your
.envfile configuration - Verify Langfuse server is running at the specified host
- Check network connectivity
- Check your
-
"No traces appearing in dashboard"
- Ensure
POCKETFLOW_TRACING_DEBUG=trueto see debug output - Check that your flow is actually being executed
- Verify Langfuse credentials are correct
- Ensure
Debug Mode
Enable debug mode to see detailed tracing information:
POCKETFLOW_TRACING_DEBUG=true
This will print detailed information about:
- Langfuse client initialization
- Trace and span creation
- Data serialization
- Error messages
📚 API Reference
@trace_flow()
Decorator to add Langfuse tracing to PocketFlow flows.
Parameters:
config(TracingConfig, optional): Custom configuration. If None, loads from environment.flow_name(str, optional): Custom name for the flow. If None, uses class name.session_id(str, optional): Session ID for grouping related traces.user_id(str, optional): User ID for the trace.
TracingConfig
Configuration class for tracing settings.
Methods:
TracingConfig.from_env(): Create config from environment variablesvalidate(): Check if configuration is validto_langfuse_kwargs(): Convert to Langfuse client kwargs
LangfuseTracer
Core tracer class for Langfuse integration.
Methods:
start_trace(): Start a new traceend_trace(): End the current tracestart_node_span(): Start a span for node executionend_node_span(): End a node execution spanflush(): Flush pending traces to Langfuse
🤝 Contributing
This cookbook is designed to be a starting point for PocketFlow observability. Feel free to extend and customize it for your specific needs!
📄 License
This cookbook follows the same license as PocketFlow.